The Numbers Are In: Here’s What’s Going on in San Mateo County
Joe Polyak November 27, 2017

Joe Polyak November 27, 2017
Today it’s time for your third quarter San Mateo County real estate market update.
Want to sell your home? Get a FREE home value report.
Want to buy a home? Search all homes for sale.
The major trend that’s still prevalent in the market today is chronically low inventory. For example, in 2016, there were 1,438 new homes that were listed in the third quarter and 672 homes left in inventory at the end of the quarter.
In the third quarter of 2017, 1,356 new homes were listed for sale—that’s a 6% drop from the previous year. At the end of quarter 3 2017, there were only 513 single-family homes for sale in all of San Mateo County, a 24% drop year over year.
The drop in inventory in condos and townhomes is even more drastic. In the third quarter of 2016, there were a total 472 new listings and 192 homes for sale at the end of the quarter. Now, in quarter 3 2017, there were 410 new listings and 126 homes in inventory. This constitutes a drop of 13% and 34% respectively.
What makes these statistics even more remarkable is that we were already in a low-inventory market last year. So far, 2017 is shaping up to be the lowest inventory market for at least the last 13 years, which is as far back as I could pull reliable MLS data.
With the decrease in supply, the average days on market—how long a home is active on the MLS from the time it was submitted to the time that its status changed to ‘sale pending’—also went down from 27 days last year to 23 days in 2017 for single-family homes. For condos, the average dropped from 22 days to 20 days.
In some cities such as Belmont, San Mateo, East Palo Alto, and El Granada, single-family homes are on the market for an average of just two weeks or less. With fewer homes for sale and high competition among buyers, prices have risen.
At the end of quarter 3 2016, the average sales $1.651 million, while the median sales price was $1.3 million. In the third quarter of 2017, those numbers became $1.79 million and $1.436 million, respectively—that’s an 8% increase and a 10% increase year over year.
So far, 2017 is shaping up to be the lowest inventory market for at least the last 13 years.
The median price per square foot for single-family homes has gone up 13% year over year, from $783 to $882, while condos have gone up from $673 to $719—a 7% increase.
On the surface, these are fairly modest increases, but let’s put them in perspective: in 2011, right around the bottom of the market, the average mean sales price of a home was $911,000, while the median sales price was $700,000. Prices have doubled in just six years!
In the third quarter of 2016, single-family homes sold for 5% over asking price, while in 2017, they sold for 9% over asking price. For condos, the year-over-year difference was 4% and 5%, respectively.
So what does all this mean to you? If you’re considering buying or selling a home, we are still in a seller’s market. Although population growth has slowed a bit, tech companies and startups are still growing and still hiring. This is bringing more buyers into the local housing market.
Another factor that’s contributing to the high demand is the increasing number of foreign buyers who are buying real estate in California. In fact, foreign investors are buying homes in the United States at record rates. With interest rates for 30-year fixed mortgages still hovering around the 3.5%-to-4% mark, it is still very enticing for buyers to take advantage of the cheap rates and buy a home.
Over the long term, is 10% to 15% year-over-year growth and real estate value sustainable? Well, this is simply supply and demand: if people who are making a lot of money keep moving to the Bay Area, and current homeowners refuse to move out of the area, then it will likely continue on this path. Low supply and high demand is currently the name of the game
If you would like to get more data from specific neighborhoods or time periods, or if you have any questions, please contact me and I’ll be more than happy to provide it for you. I look forward to hearing from you.
Stay up to date on the latest real estate trends.

May 7, 2026
Explore one of San Mateo’s hidden neighborhood hubs, from Kaizen Coffee and Sapporo Rock-N-Roll Sushi to local dessert spots, bars, and everyday conveniences.
April 30, 2026
A breakdown of rising home prices, tight inventory, and shifting demand across San Francisco and San Mateo County
April 24, 2026
A complete guide to Foster City living—waterfront homes, lagoon lifestyle, parks, schools, and what buyers need to know before moving to this quiet Peninsula community
Food
April 10, 2026
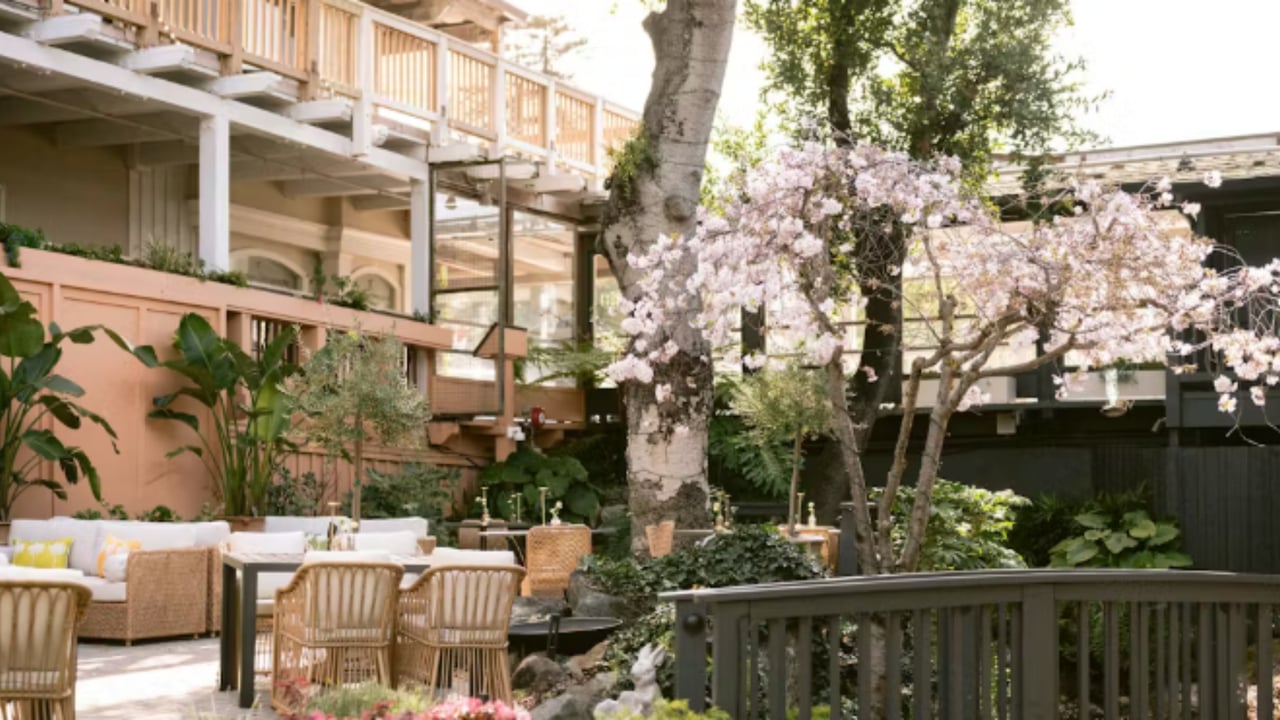
A community-driven dining experience in Belmont blending Mediterranean flavors with California ingredients
April 1, 2026
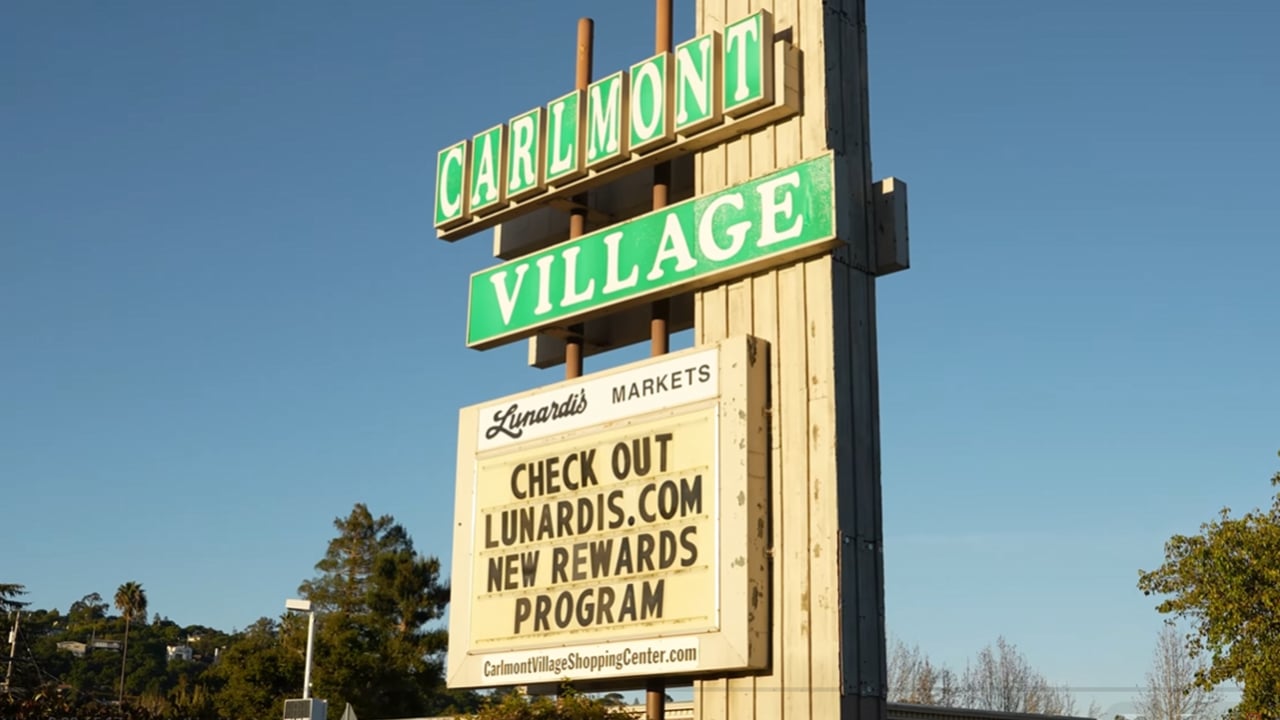
Carlmont Village Shopping Center in Belmont: A Local Hub for Food, Fitness & Everyday Living
March 25, 2026
Truffle Poke Bar Belmont: A Fresh New Spot at Carlmont Village

March 18, 2026
San Francisco Real Estate Market Update – February 2026

March 12, 2026
Could BART Service Cuts Impact Bay Area Real Estate?

Bay Area
March 6, 2026
Is AI Driving the Next Surge in Bay Area Home Prices?
You’ve got questions and we can’t wait to answer them.